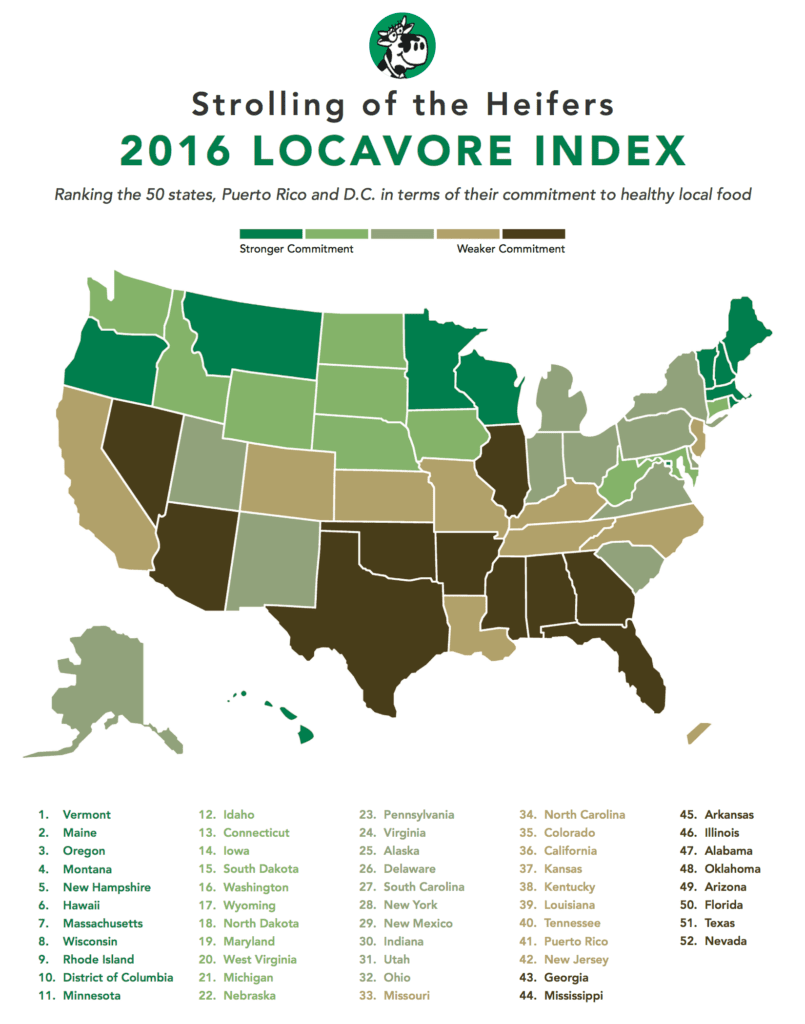
Vermont once again tops all the other states in terms of their commitment to local food, according to the 2016 Locavore Index.
The Index ranks the 50 states, plus Puerto Rico and the District of Columbia, using a variety of indicators related to local food production and consumption. It has been produced annually for five years by Strolling of the Heifers, a non-profit food advocacy organization based in Vermont.
“The Index has stimulated a lot of discussion and a lot of action in many states to improve their ranking, said Orly Munzing, founder and executive director of Strolling of the Heifers. “We’re proud that Vermont is still number one, but it is great to see so many other states following Vermont’s lead in building strong local food systems. The purpose of the Index is to stimulate efforts across the country to use more local food in homes, restaurants, schools and institutions.”
After Vermont, the next four spots in the Index are occupied by Maine, Oregon, Montana and New Hampshire, in that order. Montana is a newcomer to the top five, moving up from seventh place on the strength of strong investment of USDA Know-Your-Farmer grant funding.
Rounding out the top 10 are Hawaii, Massachusetts, Wisconsin, Rhode Island and the District of Columbia.
“While it’s exciting that Vermont remains number one in the nation for local food production and consumption, it is also exciting to witness the great strides other states are realizing in reaching these goals,” said Chuck Ross, Secretary of the Vermont Agency of Agriculture, Food and Markets. “As we all know, farmers are very effective educators, and often best positioned to promote agricultural literacy in our communities. The future of a successful agricultural economy in which farmers and producers can prosper and consumers have access to safe, affordable, healthy food depends upon an agriculturally literate and engaged public. The Locavore Index helps us track our progress and work towards that success.”
This year’s Index incorporates new data from the US Department of Agriculture on its Know Your Farmer – Know your Food grants. These were calculated on a per-capita basis for each state. Vermont, the top-ranked state, received $21.43 per person in such grants, more than twice the amount for North Dakota ($10.10), which came in second in this category.
The Index also incorporates updated information on the number of farmers markets, the number of CSAs, the number of food hubs — all compared on a per-capita basis — along with the percentage of each state’s school districts with active Farm-to-School programs and the percentage of the budgets of those programs spent on local food.
The index continues to include data from the USDA’s Census of Agriculture, including data on the dollar volume of direct-to-the-public food sales by farmers, including sales at farmers markets, community-supported agriculture operations (CSAs), farmstands and online sales. But since this Census data has not been updated since 2012, its weight within the Index has been reduced.
Puerto Rico is included in the Index for the first time this year. Even though its local-food movement is still fledgling (it has only one CSA), it came in 41st, ahead of New Jersey and Georgia, on the strength of a strong farm-to-school program in its schools.
Martin Langeveld, who researches and compiles the Index for Strolling of the Heifers, commenting on the evolution of the Index, said, “It’s interesting to see that each year, there is a greater variety of metrics available around local food, and developing more of them is important. Many states and the federal government have programs to build the consumption of local foods, but to assess the effect of those efforts, we need more and better metrics.”
Strolling of the Heifers lists 10 reasons for people to increase their use of local foods, stressing that local foods are more sustainable, healthier, better for the environment and economically positive than foods sourced from large-scale, globalized food systems.
Strolling of the Heifers’ 10 reasons to consume more local foods:
- Supports local farms: Buying local food keeps local farms healthy and creates local jobs at farms and in local food processing and distribution systems.
- Boosts local economy:Food dollars spent at local farms and food producers stay in the local economy, creating more jobs at other local businesses.
- Less travel:Local food travels much less distance to market than typical fresh or processed grocery store foods, therefore using less fuel and generating less greenhouse gases.
- Less waste:Because of the shorter distribution chains for local foods, less food is wasted in distribution, warehousing and merchandising.
- More freshness:Local food is fresher, healthier and tastes better, because it spends less time in transit from farm to plate, and therefore loses fewer nutrients and incurs less spoilage.
- New and better flavors in each season:When you commit to buy more local food, you’ll discover interesting new foods, tasty new ways to prepare food, and a new appreciation of the pleasure of each season’s foods.
- Good for the gene pool and the soil:Local food encourages diversification of local agriculture which preserves genetic diversity and reduces the reliance on monoculture — single crops grown over a wide area to the detriment of soils.
- Attracts tourists:Local foods promote agritourism — farmers markets and opportunities to visit farms and local food producers help draw tourists to a region.
- Preserves open space:Buying local food helps local farms survive and thrive, keeping land from being redeveloped into suburban sprawl.
- Builds more connected communities:Local foods create more vibrant communities by connecting people with the farmers and food producers who bring them healthy local foods. As customers of CSAs and farmers markets have discovered, they are great places to meet and connect with friends as well as farmers!
The Components of the Index are:
- Direct-to-the-public food sales revenue at farms, including sales via farmstands, farmers markets, CSAs and online sales, calculated on a per-capita basis for each state.
- Farmers markets, which are generally cooperative efforts to market locally produced food in a central location where consumers can select and purchase food from multiple farm enterprises.
- CSAs (consumer-supported agriculture), which are cooperative agreements between farmers and consumers; consumers buy shares in a farm’s output, and have some say in what is grown. When crops come in, they are divided among shareholders according to the volume of their shares, and the rest may be sold at market. CSA farmers get revenue in advance to cover costs of tilling, soil preparation and seed. Shareholders get fresh produce grown locally and contribute to sustainable farming practices
- Farm-to-School programs, in which schools buy and feature locally produced, farm-fresh foods. Participating schools usually also add nutrition, culinary and food science components to their curriculum, and may experiential learning opportunities such as farm visits, school gardens and composting. The Index includes includes, for each stage, both the percentage of school districts which have farm-to-school programs, and the average percentage of district food budgets spent on local food. Food hubs, which are facilities that handle the aggregation, distribution and marketing of foods from a group of farms and food producers in a region. Food hubs are often cooperatively owned, though many are private enterprises.
- Know your Farmer, Know your Food grants are given by the USDA to help communities scale up local and regional food systems and strengthen their economies. They include funding for food hubs, farmers markets, individual farmers, farm cooperatives, schools and other entities.
Sources for the data used in the Index includes two regularly updated U.S. Department of Agriculture databases for farmers markets and food hubs; the 2015 USDA Farm-to-School Census; the USDA’s 2012 Census of Agriculture; the U.S. Census bureau (July 2015 estimates of population); the California-based local food resource directory LocalHarvest, a frequently-updated database of CSAs; and the USDA’s database of Know Your Farmer, Know your Food grants covering 2009-2014.
The Index is calculated as the weighted average ranking in all of the component categories. The weighting is as follows: farmers markets per 100,000 — 15 percent; CSAs per 100,000 — 15 percent; Farm to School (product of participation rate and budget percentage) — 15 percent; Food Hubs per 100,000 — 5 percent; direct sales per capita — 30 percent; USDA Know-Your-Farmer grants per capita 20 percent. The full data set with formulas is available at www.strollingoftheheifers.com/locavoreindex.
About Strolling of the Heifers:
Strolling of the Heifers is a Vermont-based food advocacy organization that works year-round to strengthen local food systems by connecting people with healthy local food and encouraging innovation and entrepreneurship in the farm and food sectors. “The Stroll” has been supporting and celebrating local farmers and local food since 2002, most visibly through its agriculturally-themed Strolling of the Heifers Parade and Expo, which take place on June 4 in Brattleboro, Vt. as part of a full weekend of events. The Stroll’s year-round programs include the Slow Living Summit, the Farm-to-Table Culinary Apprenticeship Program, and Windham Grows.
On the web: www.StrollingoftheHeifers.com, www.SlowLivingSummit.org.
For further information about the Index, please contact Martin Langeveld, Strolling of the Heifers —[email protected]
For information on the prior year Indexes, visit these pages:
Here is the 2016 Strolling of the Heifers Locavore Index ranking of the states (with the 2015 rank in parentheses):
- Vermont (1)
- Maine (2)
- Oregon (4)
- Montana (7)
- New Hampshire (3)
- Hawaii (8)
- Massachusetts (5)
- Wisconsin (6)
- Rhode Island (9)
- District of Columbia (18)
- Minnesota (11)
- Idaho (16)
- Connecticut (10)
- Iowa (13)
- South Dakota (24)
- Washington (12)
- Wyoming (22)
- North Dakota (31)
- Maryland (21)
- West Virginia (14)
- Michigan (15)
- Nebraska (27)
- Pennsylvania (17)
- Virginia (19)
- Alaska (33)
- Delaware (25)
- South Carolina (23)
- New York (20)
- New Mexico (32)
- Indiana (35)
- Utah (30)
- Ohio (34)
- Missouri (37)
- North Carolina (28)
- Colorado (26)
- California (36)
- Kansas (38)
- Kentucky (29)
- Louisiana (47)
- Tennessee (40)
- Puerto Rico (not ranked)
- New Jersey (39)
- Georgia (44)
- Mississippi (46)
- Arkansas (42)
- Illinois (41)
- Alabama (43)
- Oklahoma (45)
- Arizona (50)
- Florida (48)
- Texas (51)
- Nevada (49)